НАЧАЛО ГЛОБАЛЬНЫХ ТОРГОВЫЙ ВОЙН
From the point of view of economic growth doesn’t matter whether the Earth’s population of 7.5 million people or 7.5 billion… What is important is the dynamics of the economically active population, i.e. changes in the structure of consumers and workers.
Economic growth (or the ability to consume no longer produce more) is the annual growth of the population at the expense of people with income, savings, and access to credit (or government social security programs). That is the essence of the current trade war and why it is just beginning. At first it was a fight against slowing growth… But now we are talking about reducing the number of consumers.
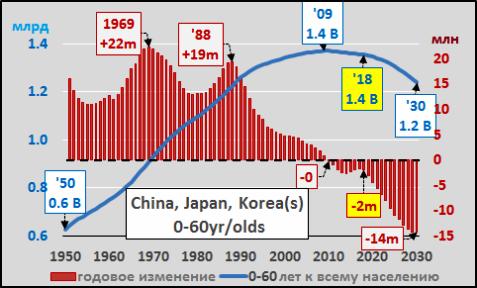
Nowhere is this decline in potential consumers more acute than in East Asia (China, Japan, North and South Korea, Taiwan, as well as some other less significant countries). The chart below shows the total population of East Asia under the age of 60 (blue line) and its annual change in red columns. The peak of population growth under the age of 60 years (consumer base) was reached in 1969, adding 22 million potential consumers annually.
Relatively recently, in 1988, the “echo” of that peak added 19 million per year, but the slowdown since 1988 has been steady. Then, in 2009, it led to a decline that will continue indefinitely. What started as a mild slump is about to turn into more and more tumultuous excitement. By 2030, the ratio of the population under 60 years / over 60 years will be 9% lower than it is now. East Asia’s domestic consumer market is collapsing in real time, and its dependence on exports is greater than ever.
The graph below shows the total world population aged 0-65 years (minus Africa and India – the blue line) and the annual change in this number in the red columns.
Why is Africa and India excluded? Because they, representing almost all of the global population growth, consume less than 10% of world exports without sufficient income, savings or access to credit for consumption compared to the rest of the world.
This figure peaked in 1988, adding 52 million major consumers each year. However, the annual growth of this population slowed by 2/3 to” some ” 17 million in 2018. By 2030 the total number of people younger than 65 will reach a peak and begin to decline.
Simply put, the West and the East are fighting for a rapidly shrinking pie. Of course, individual companies will perform better than others… But at the macroeconomic level, global demand will fall for an indefinite period, despite debt programs and monetization schemes that can be implemented by Federal governments and Central banks.
From the point of view of increasing the value of assets, consider the slow (and rapid decline) of the consumer population versus growth assets. The following graph shows the same annual increase in the population under 65 years of age (blue bars, minus Africa and India) compared to the rapidly growing Wilshire 5000 index (all publicly traded us stocks, yellow line) and global debt (red line).
Then consider the slowing annual global population growth (the red line as a percentage of the total population, minus Africa and India) compared to the estimated unlimited asset growth of 7.5% per year (the blue line shows that the Wilshire 5000 is constantly growing by 7.5%) and the rapidly slowing increase in the number of consumers. Obviously, the expected increase in asset value is due to rising debt and monetization rather than natural economic growth.
Finally, let’s look at the situation in the US. The following graph shows the rapid slowdown in the annual growth of the U.S. population under the age of 65 years in % of total population (black line), departing up the Wilshire 5000 index (shaded red area), the actual and expected increase of 7.5% of the U.S. stock market since 1970 and 2025 (dotted yellow line) and total disposable personal income, reflecting the actual economy (blue line).
THE SLOWDOWN IN THE ANNUAL GROWTH OF THE U.S. POPULATION UNDER THE AGE OF 65 YEARS IN % OF TOTAL POPULATION
It becomes obvious that monetary measures and the pursuit of beautiful economic indicators pushed to the background the main problem of the modern economy – the aging population, which reduces the production and consumer characteristics of the entire human population.
Instead, statesmen are trying to patch holes in their own economy, ripping off “patches” from their trading partners. Unfortunately, in doing so, we are only getting closer to the painful cost of decades of misunderstanding of the seriousness of the global demographic problem.
One of the most common terms in economic news releases is GDP — gross domestic…
The Center for Analysis of Strategies and Technologies publishes a report that provides an overview…
The RAND Corporation (short for Research and Development) became the world's first "think tank". It…
Marxism did not provide a meaningful answer to the fundamental questions of existence in the…
Corruption is fought actively, loudly and at all levels: it is eradicated, reprimanded for it,…
It is time to put an unambiguous bold point in the discussion of the events…